ColdFusion Scales Easily
Right after the importance of tuning the JVM, comes the value of properly managing threads in ColdFusion. We want to ensure that threads are responding quickly and not becoming “hung” (endlessly waiting for a resource). A hung thread is a dangerous condition for a server. Too many hung threads and the server becomes unresponsive as it is unable to process any further requests (no threads available). Request queuing often takes the blame for performance problems in JAVA based applications, but this is a bit like blaming the ambulance for life-threatening traffic accidents. Every time a severe accident occurs, an ambulance shows up. The process of queuing threads is a critical feature that keeps the host CPU and other critical resources from being 100% saturated, which could then push the server into an unrecoverable state. When queuing is tuned correctly, the flow of incoming processes under high load can be processed much more efficiently, because the queuing safeguards incoming requests from adding insult to injury on an already taxed CPU and or third party resources.
There can also be a cause and effect between threads, excessive heap consumption, and repeating full GC cycles, in that unresponsive threads can keep objects locked in the heap. Each thread (or stack) has a memory footprint, and if a request is hung, its memory objects cannot be collected and flushed out of the heap.
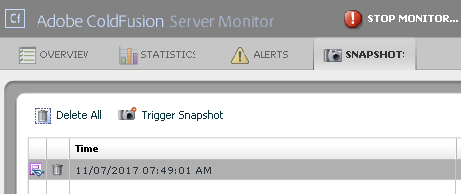
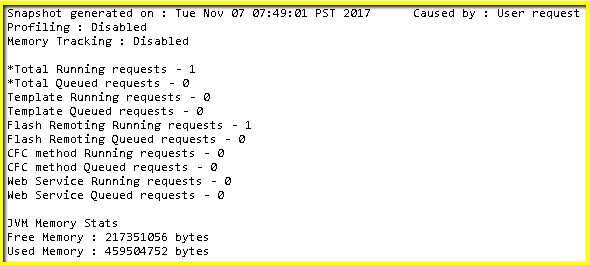
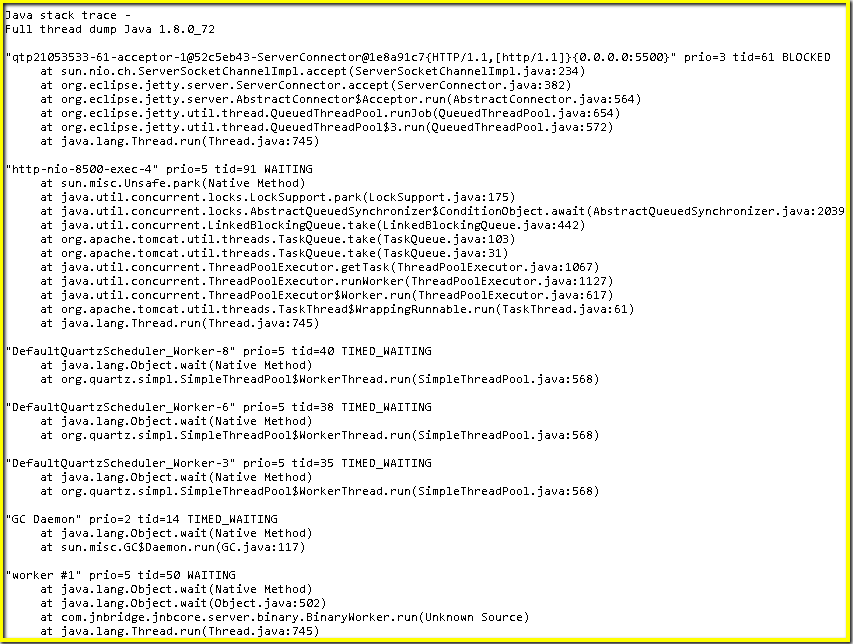
Here is a sample of part of a stack trace on a single thread in the JVM, which was taken using the “Snapshot” feature while using the built-in ColdFusion Server Monitor.
Capturing and reading a thread dump maybe necessary at times, but is not an everyday necessity. Parsing a thread dump can seem a bit daunting. There are various ways to read a stack trace. Various tools exist and some profilers can read them in real-time. However they typically impose a very heavy performance penalty. Running profilers over thread dumps and snapshots is something you want to do when troubleshooting only.
The most effective way to tune CF and the JVM is to enable and configure the right JVM logs, and locate the right timescale of performance trouble. Analyzing what was going at a very specific time and what requests were affected at that time can be found in {CF-HOME}/logs/metrics.log.
We Enable Metrics Logging in the Debug Output Settings in ColdFusion Administrator, we should also check Enable CFSTAT. Both are unchecked by default.
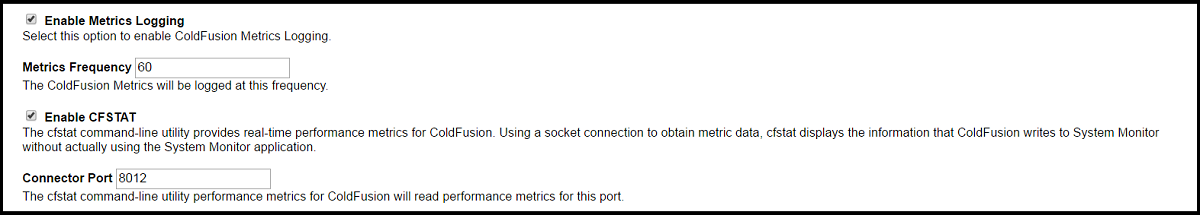
There is one more very important change to make. The Connector Port will almost certainly have the wrong setting. To correct that we need to look at the {CF-HOME}/runtime/conf/server.xml file. In that file, find this item:
<Connector protocol="AJP/1.3" port="8012" redirectPort="8445" maxThreads="500" connectionTimeout="60000" tomcatAuthentication="false"/>
As in our example above we changed the Connector Port specified in Debug Output Settings to 8012 as per our server.xml file. After a restart of the instance metrics logging will be running successfully and accurately.
Here is an extract from the metrics.log. It is a snapshot from the server in 60 second intervals.
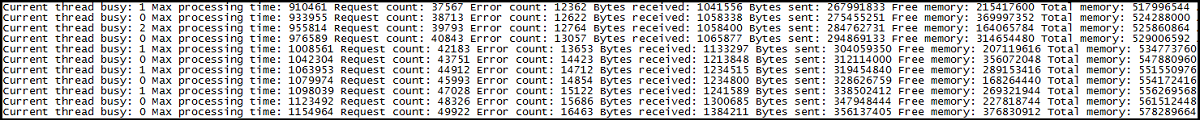
What we are particularly interested in here first is the Current thread busy metric which should always be as it is here: low and cycling. At the first sign of thread related problems we will see that number climb and not recover much. We may also see “Free memory” diminishing at the same time. By noting the date and time of the trouble starting, we can then look at the other logs in ColdFusion to see if any errors or anomalies were experienced at the same time. It’s more common than not to find a third party resource like a database call or external web service call that has hung the thread, but ColdFusion usually takes the blame.
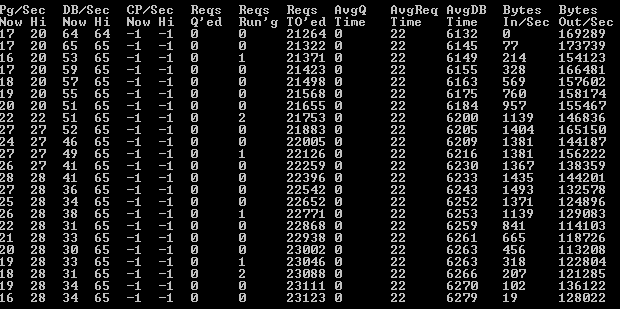
CFSTAT is also a helpful command line tool and is natively packaged with ColdFusion. Below is an example of CFSTAT running during the same load test as the metrics log above. A quick glance at CFSTAT will show you real-time metrics on concurrently running requests, queued requests, timed-out requests, average request times, and so on.
In addition to the built-in tools that ship with ColFusion, there are also very capable third-party tool which can be purchased. The two most popular options are as FusionReactor and SeeFusion.
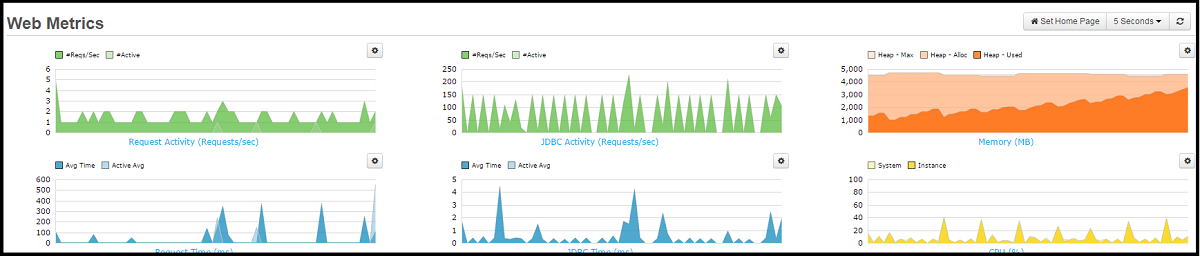
This is a screenshot of FusionReactor’s Web Metrics view, and is one of the many views available.
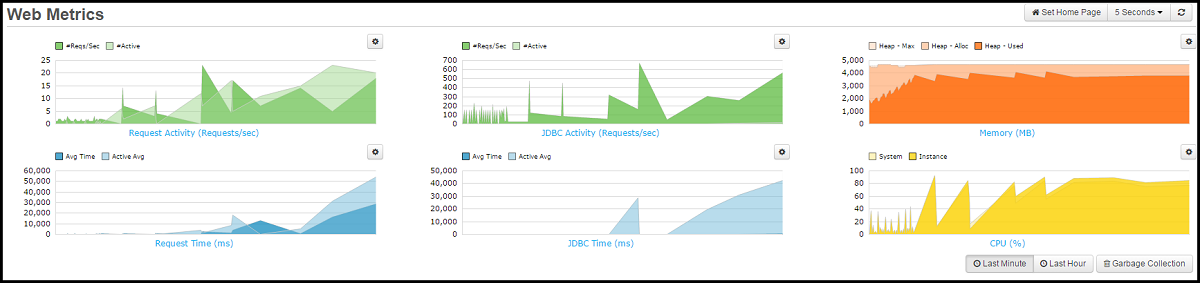
In this next screenshot, we can see clearly on the left-most graphs that threads are hanging and they are causing the heap memory (shown in the top right graph) to be exhausted.
One other key feature of FusionReactor (and there are many) is the profuse logging. These logs are archived hourly (or at a JVM failure) and are stored on the server. Depending on the ColdFusion installation and garbage collector in use, there can be up to 30 logs.
Tip: An excellent article on how best to view and use these logs can be found here.
Tip: FusionReactor is a very capable Java monitor, and is not limited to ColdFusion analysis.
SeeFusion is another powerful tool for analyzing the performance and underlying metrics of a ColdFusion server. Here is the main “Server” screen from SeeFusion.
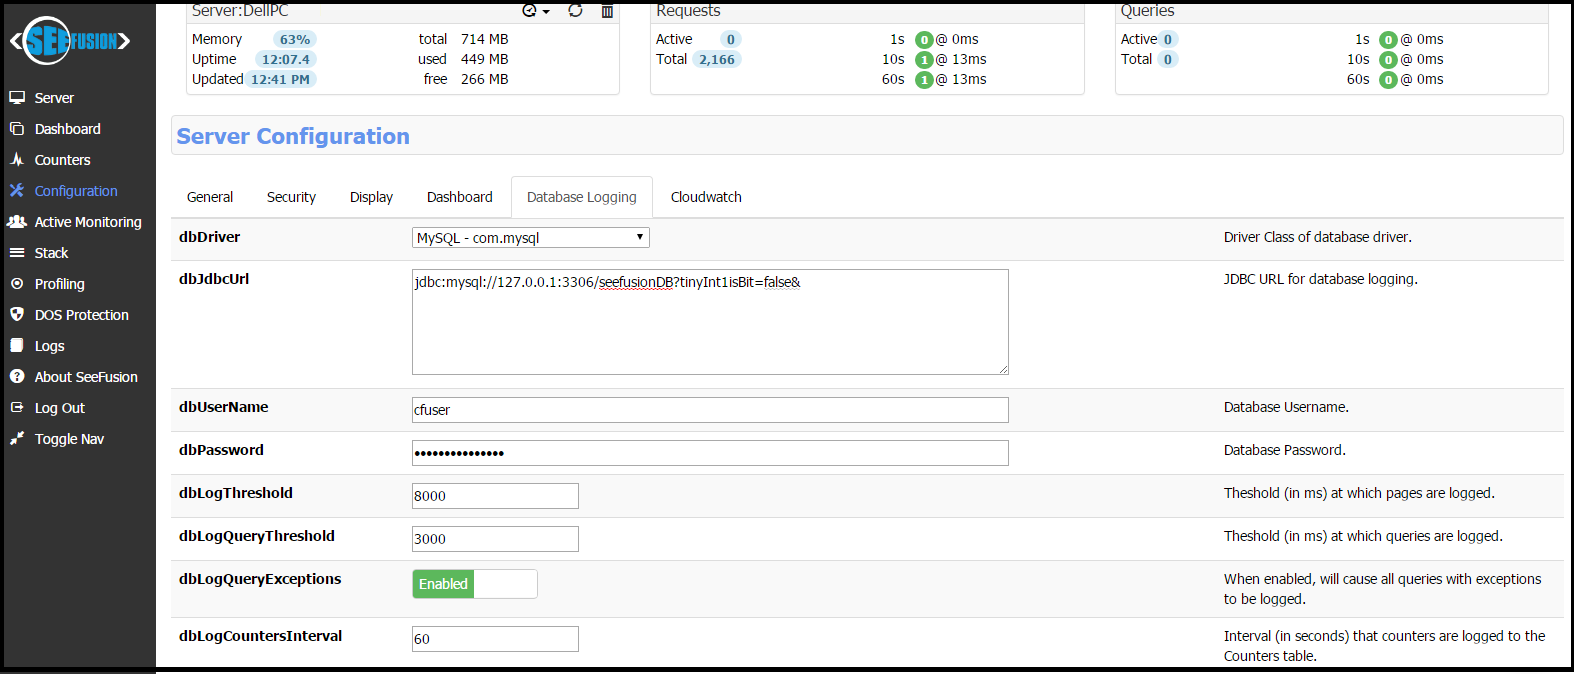
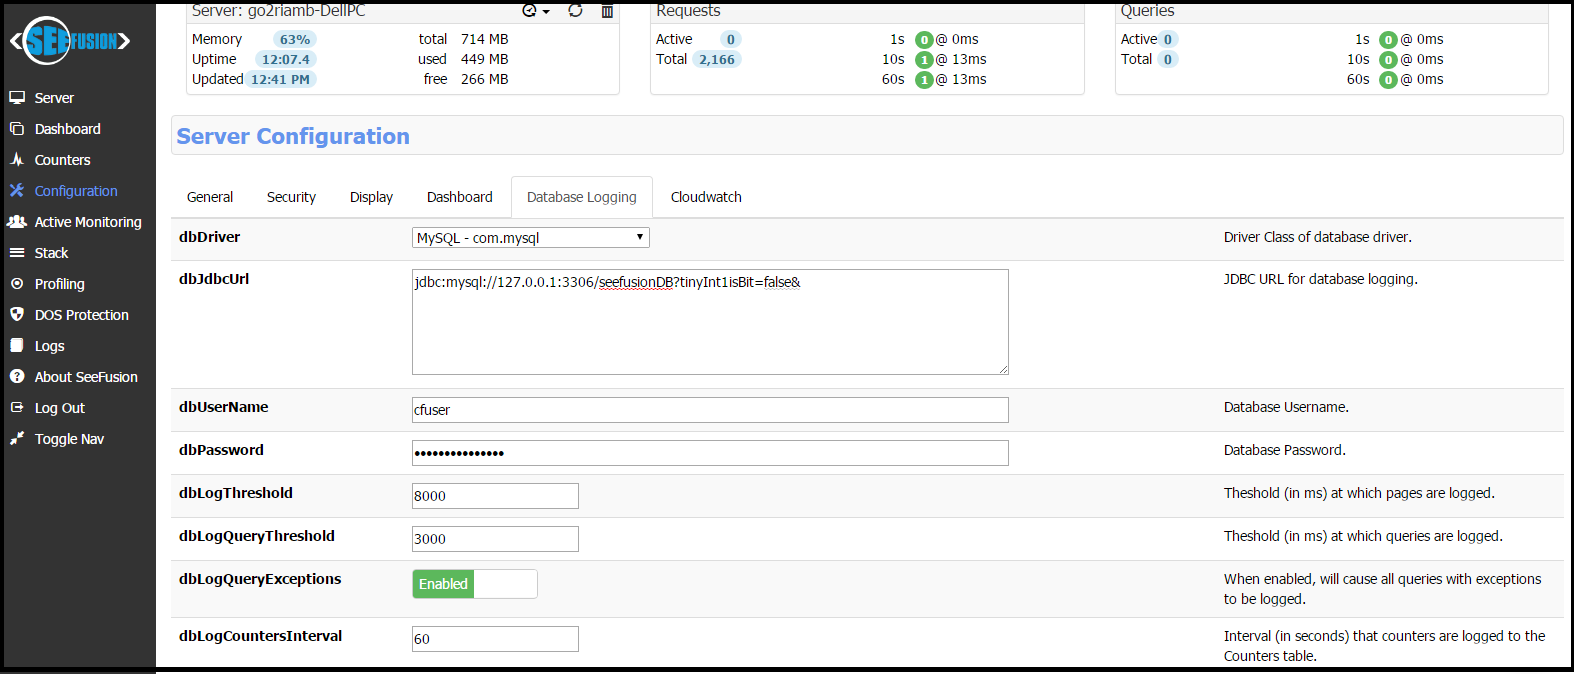
SeeFusion Enterprise has one advantage over FusionReactor. It is easy to configure SeeFusion logging to a database via the following screen.
We have used both, and each have their own strong points.
The other tool available for monitoring both heap memory and threads in ColdFusion Enterprise is the ColdFusion Server Monitor.