ColdFusion provides a wealth of options for investigating the operation of your server and application. The tools available within the Debugging & Logging section of the Administrator can help you resolve errors in your code, understand performance issues, and facilitate the maintenance of your application.
Debugging Output Settings
Recommendations for the settings on this page depend on which environment you are configuring.
Development: Enable Robust Exception Information will aid your development by displaying detailed information about the state of the application during an error. We recommend enabling this option. Enable Request Debugging Output will provide detailed runtime information after the execution of every request (below the output HTML code). We also recommend this enabling this setting.
Production: Disable all settings in your running configuration. Displaying any debugging information in the browser introduces potential security issues and adds overhead to each request. If debugging or performance tuning is required in your production environment, the server being targeted should be removed from your cluster before starting any investigation.
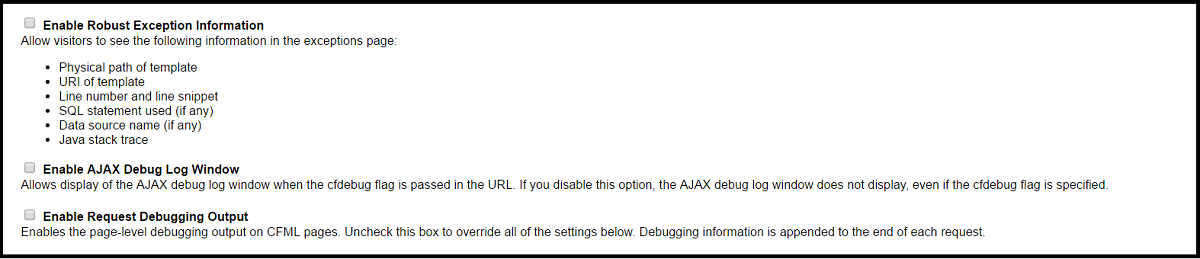
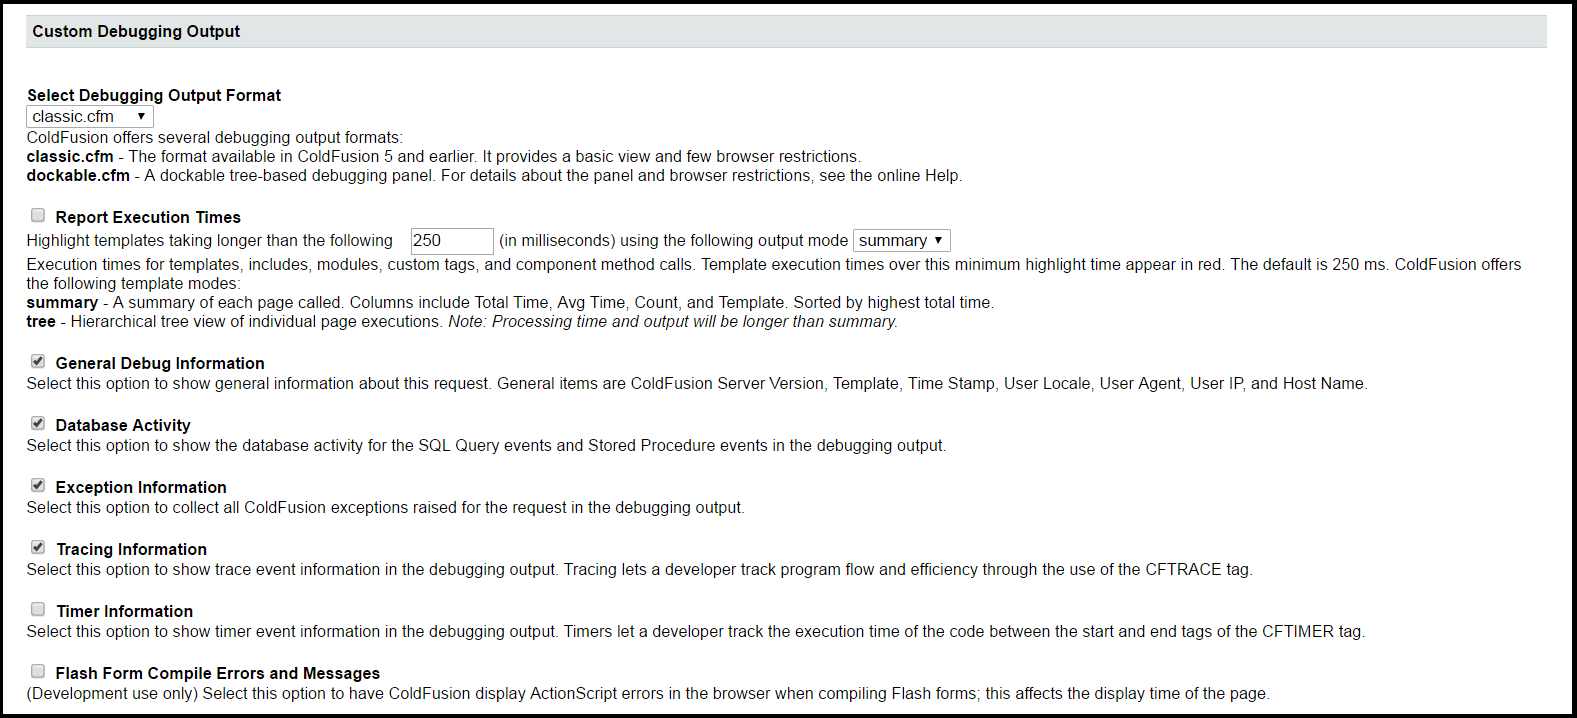
When Enable Request Debugging Output is checked, the following options are available for your use. You can customize which information is captured and displayed below your page output. These settings should only be applied in your development environment. They should all be disabled (unchecked) in production.
Tip: Our research has shown that in some versions of ColdFusion, leaving Report Execution Times enabled while Enable Request Debugging Output was disabled would still cause ColdFusion to perform excessive background processing on every request, leading to significant overhead. It is highly recommended to disable Report Execution Times regardless of the Enable Request Debugging Output setting in your production environment.
Here are the remaining settings in this section.

We recommend some changes from the defaults to aid your debugging effort in your development environment.
- Variables: Enable all variables.
- Enable Performance Monitoring: Enable this in Windows environments to expose ColdFusion performance data within the Windows Performance Monitor.
- Enable Metrics Logging: Enable. Metrics Logging is a powerful tool when troubleshooting or tuning your server. ColdFusion will begin capturing data in
{CF-HOME}/logs. - Enable CFSTAT: Especially useful in ColdFusion Standard where Server Monitor is not available. See here for an excellent overview of cfstat and how to use it to uncover performance issues. Restart required.
- Connector Port: This is the internal port which ColdFusion uses to connect to the external web server (IIS, Apache etc). By default, this is set to 8500 (the internal web server). In order to get the right value, check
{CF-HOME}/runtime/conf/server.xmlat the following entry and use theportvalue.

Tip: If you have enabled these settings but still don’t see inline debug output, head over to the Debugging IP Addresses page to verify that debugging is enabled for your IP.